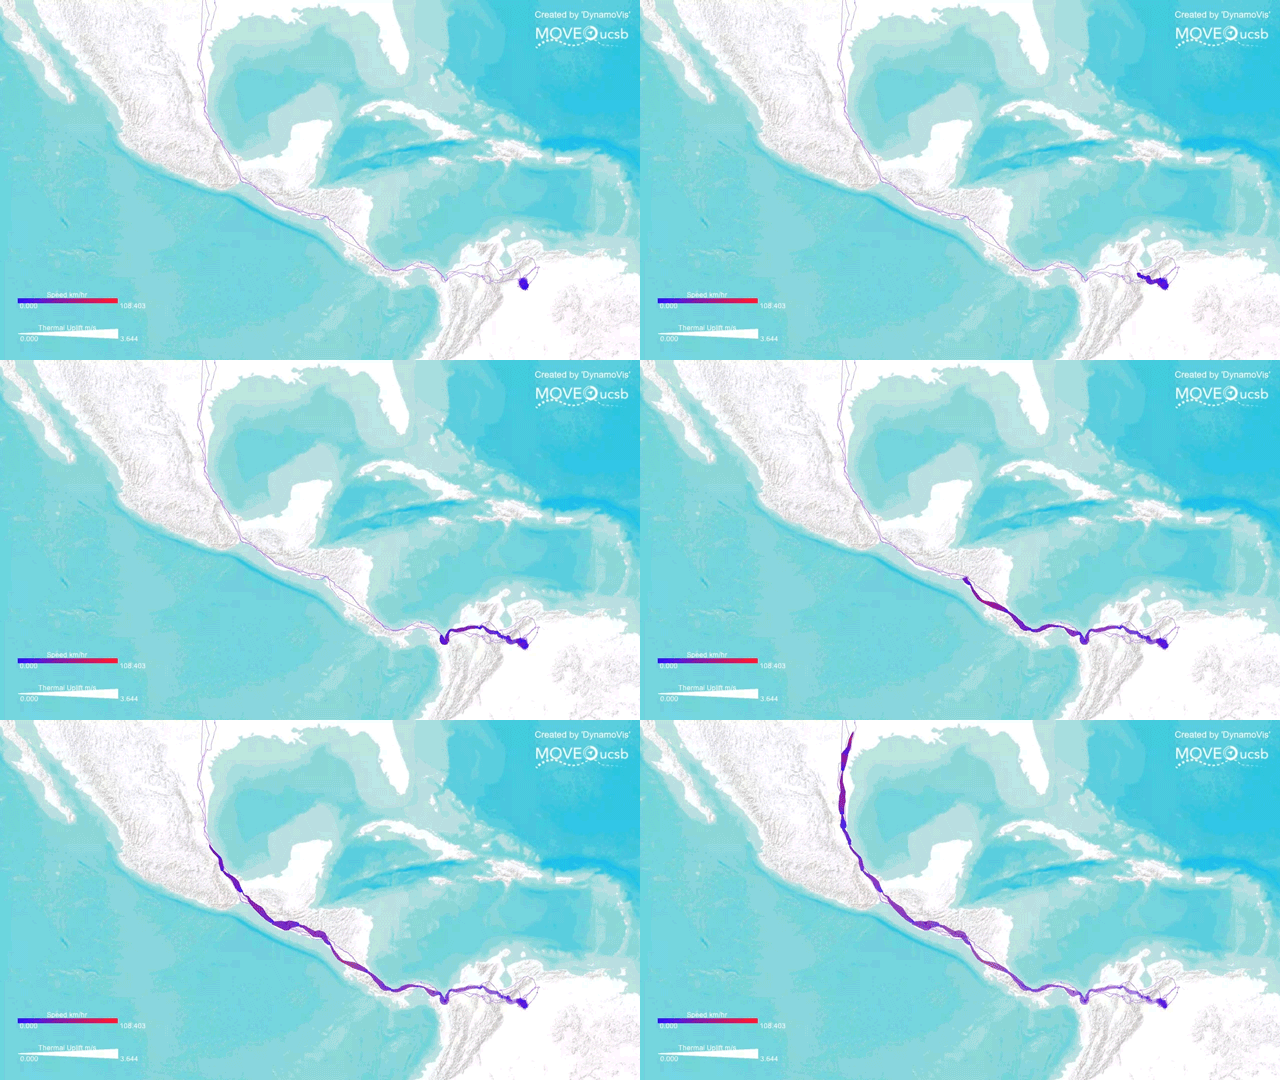
DynamoVis
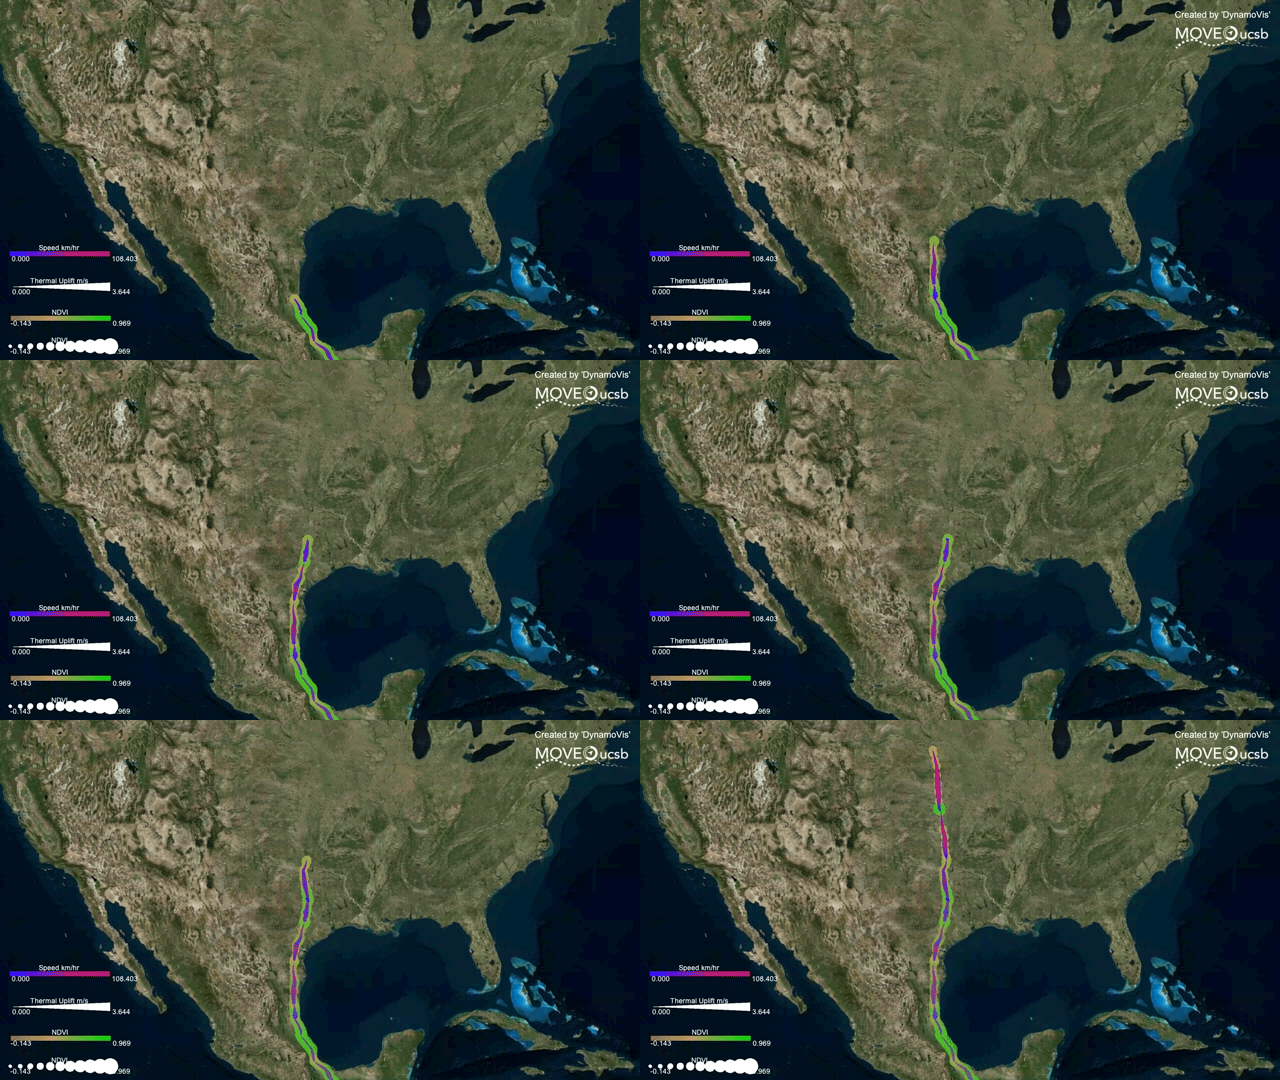
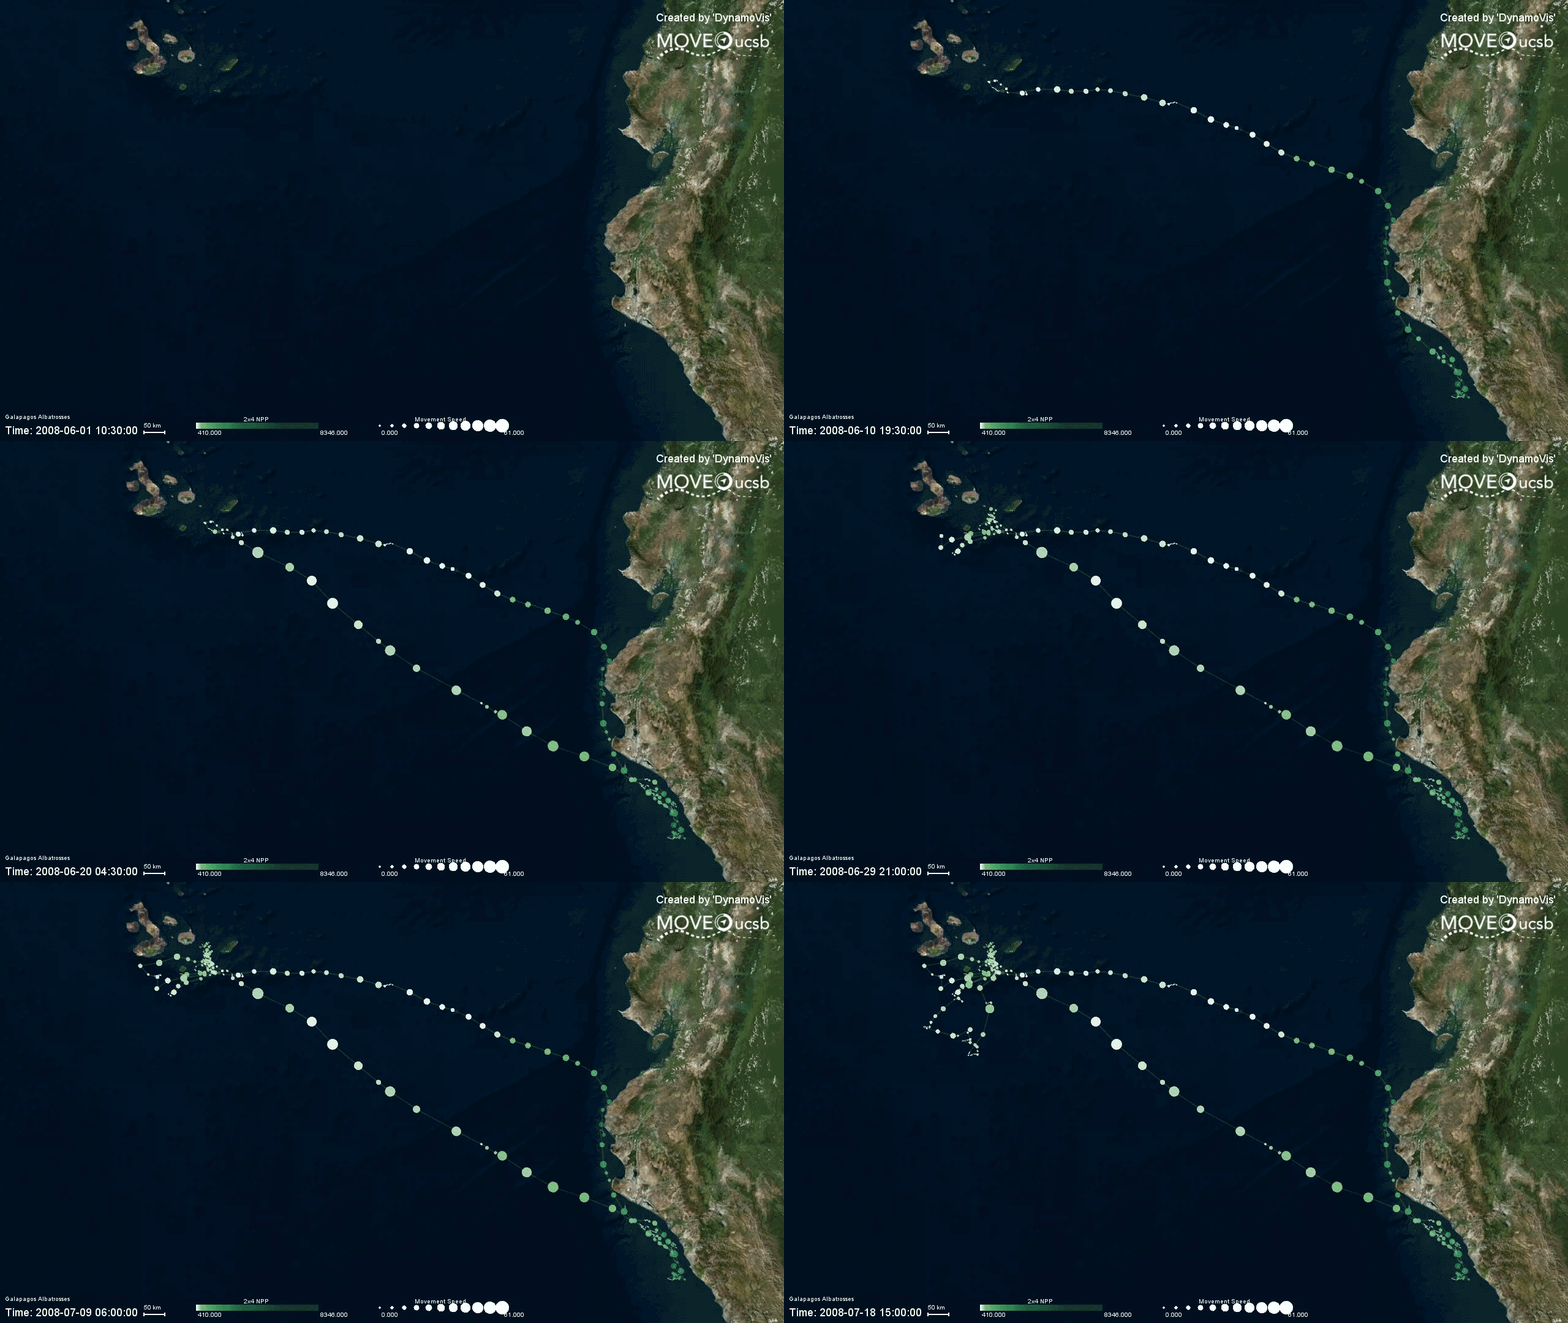
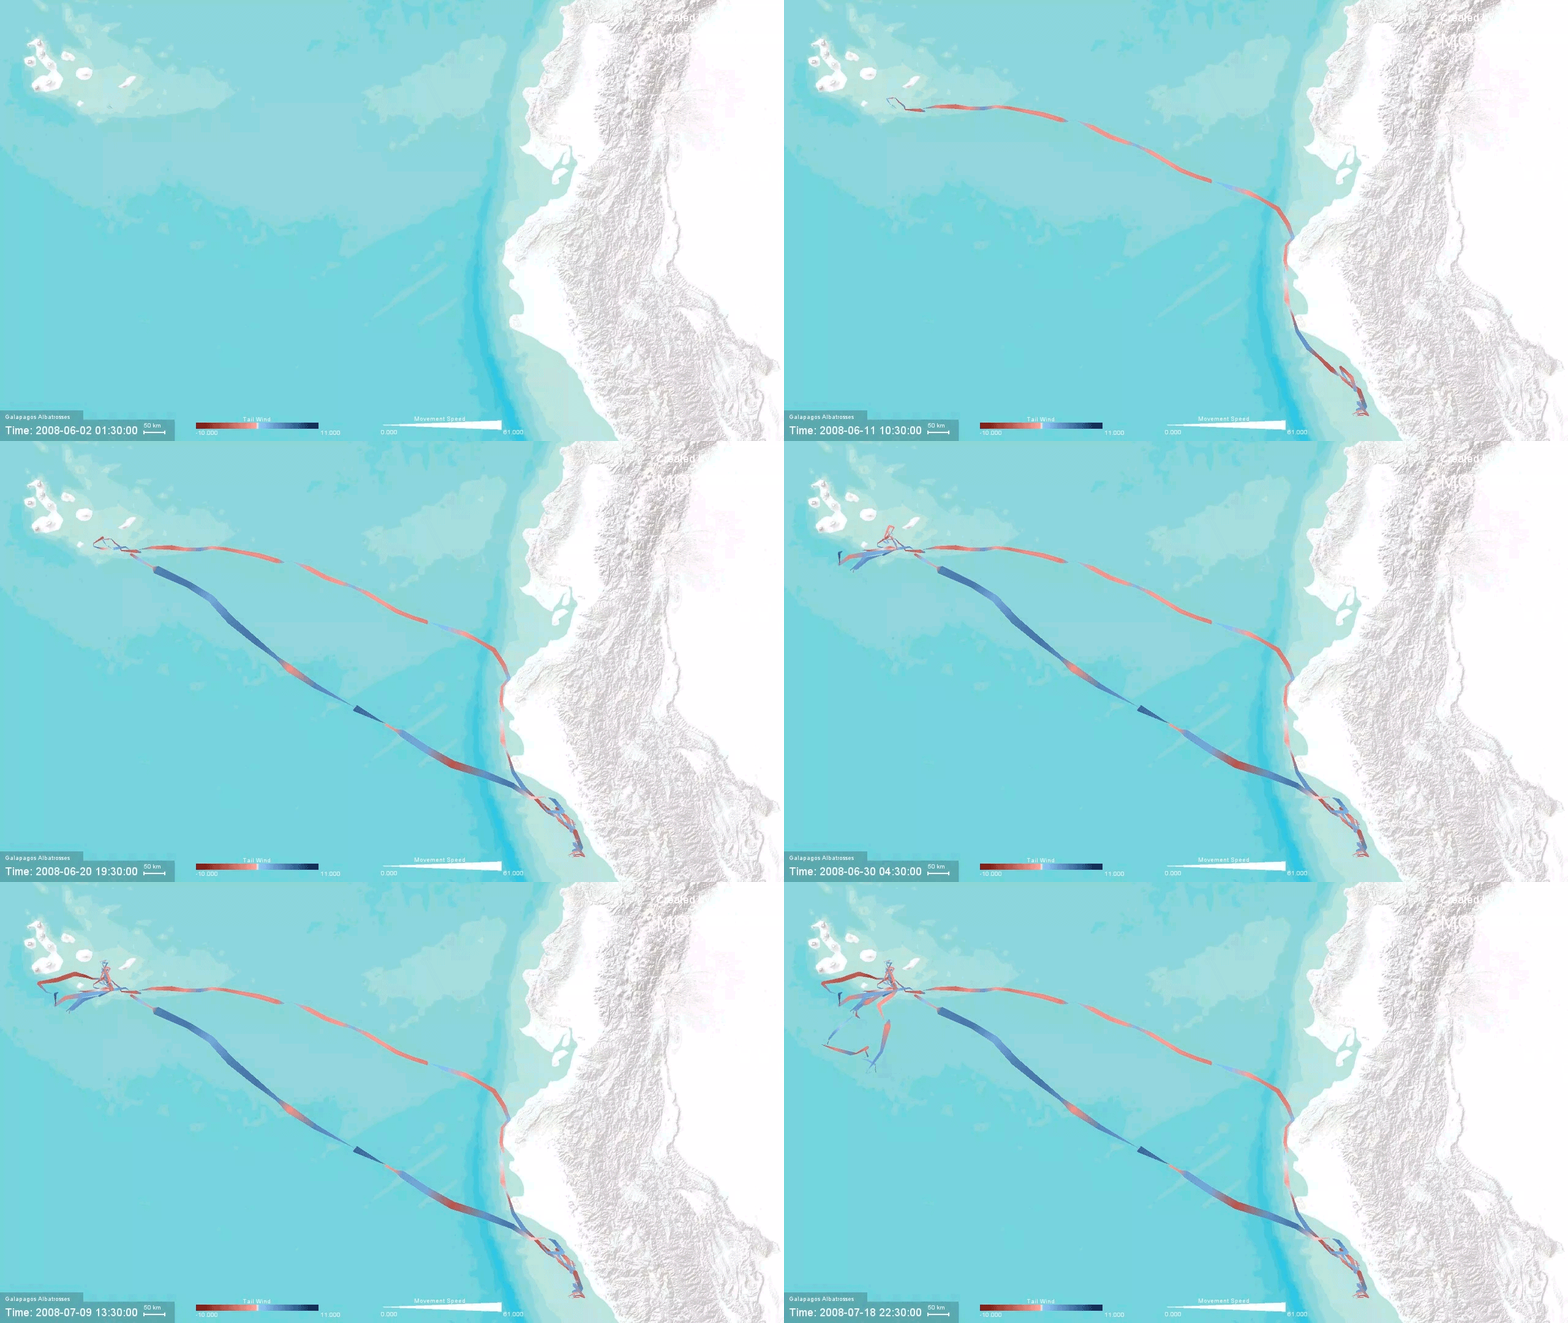
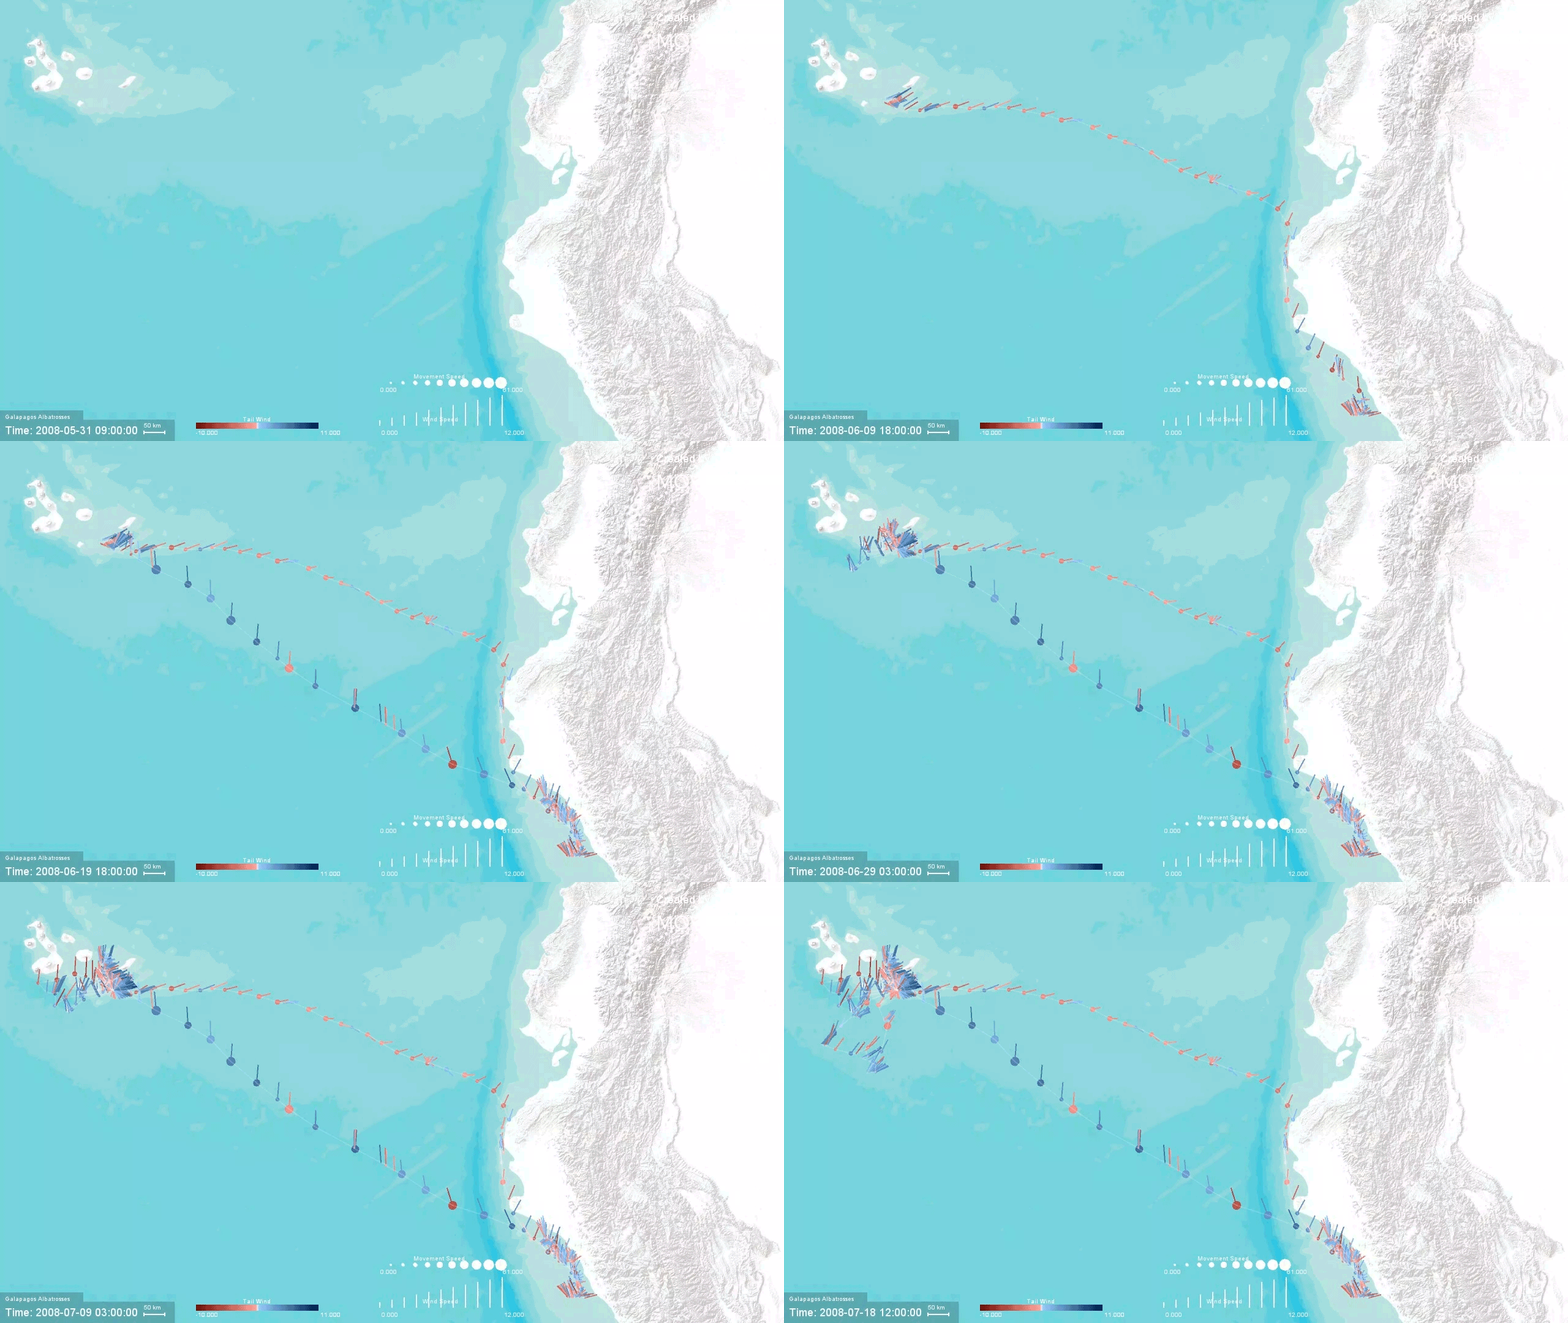
DynamoVis is a data visualization software specifically targeted for spatiotemporal movement data. It is developed by Move Lab @ UC Santa Barbara and designed to be accessible and easily usable for scientists without extensive prior experience with programming, GIS software, or custom data visualization tools. The intuitive design focuses on a simple interface for scientists to apply spatial data visualization techniques, giving ecologists and biologists of all backgrounds the power to visualize complicated spatial patterns.
In 2023 I began working with the Move Lab to enhance the Java application of DynamoVis, specifically focusing on the UI. I have added a new mode to view migration data as part of a Space-Time Cube and added more interactivity and customization options for the timeline of migration events. I will continue working with the Move Lab team in preparation for an upcoming study and paper.
